Geopolitics & Markets
How to Use Geopolitics as a Market Signal: The Investor’s Framework for 2026 and Beyond
Geopolitical events are the most underutilized signal in retail investing. Here’s the professional framework for reading geopolitical risk and translating it into portfolio decisions.
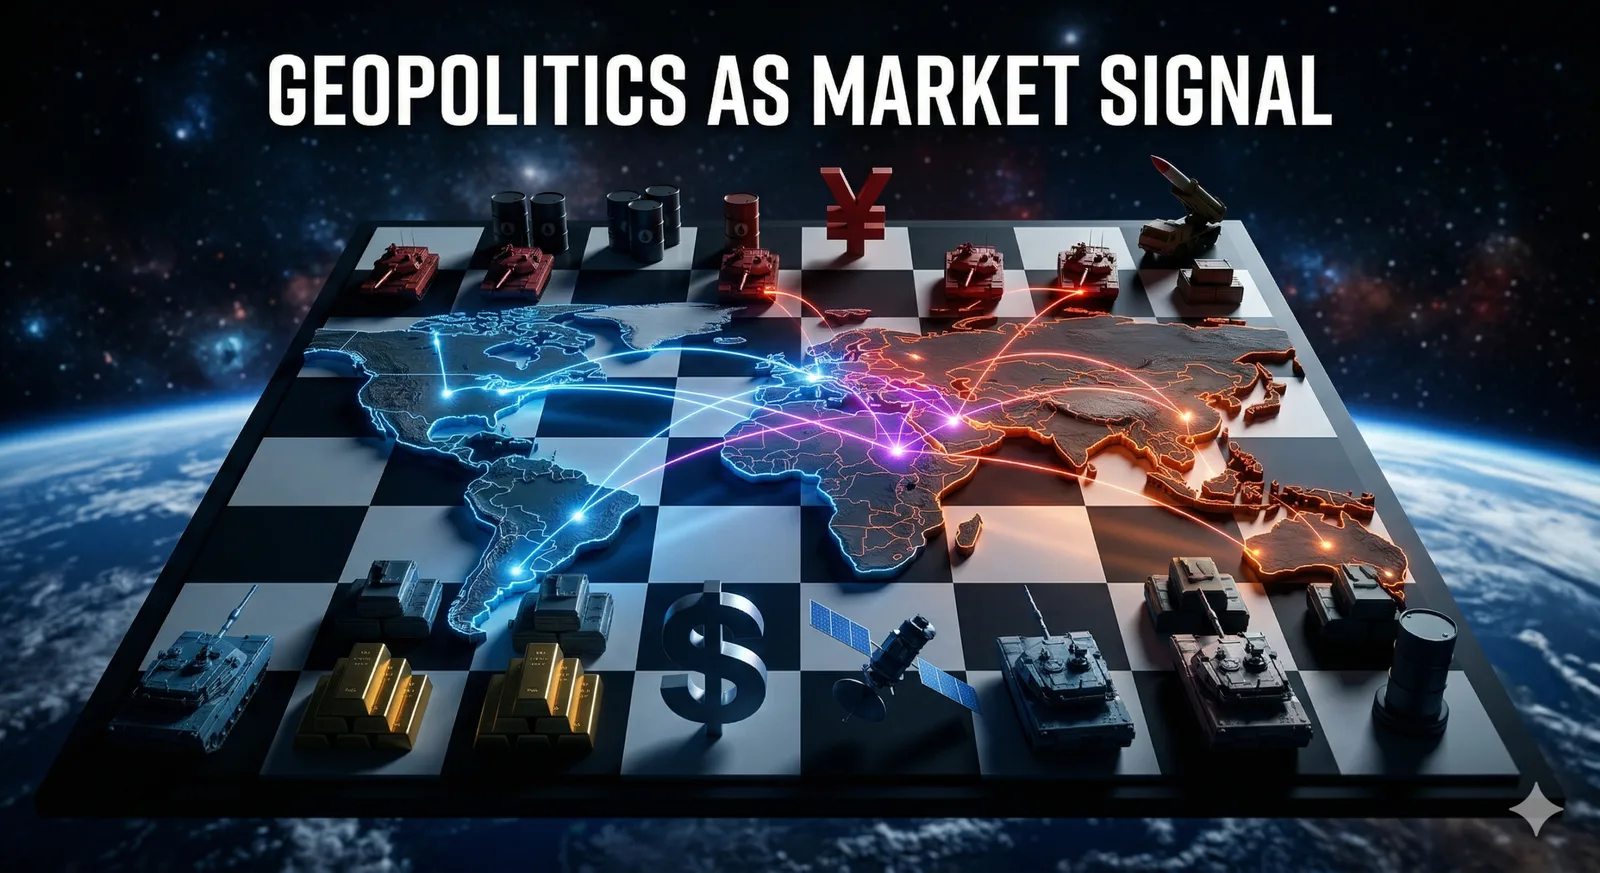
The Iran war. The US-China chip conflict. NATO’s expanding defense budgets. The dollar’s contested reserve status. Tariff wars. These are not background noise for investors — they are the dominant drivers of asset prices in 2026. And yet, the vast majority of retail investors have no systematic framework for incorporating geopolitical signals into their investment decisions. That is a profound competitive disadvantage.
Why Geopolitics Moves Markets
Markets are pricing machines. They aggregate the collective expectations of millions of participants about future cash flows, growth rates, interest rates, and risk premiums. Geopolitical events disrupt virtually every variable in that calculation — simultaneously and often in unpredictable ways. A military conflict can spike energy prices, raise inflation expectations, force central bank policy pivots, redirect government spending, disrupt supply chains, and alter the relative attractiveness of entire asset classes — all in the space of days.
European natural gas
The Geopolitical Risk Framework: Four Dimensions
Probability refers to the likelihood that a geopolitical scenario actually materializes. The investor advantage is not in predicting events with certainty but in having a disciplined view on whether current market pricing reflects realistic probability assessments.
Impact refers to the magnitude of market disruption if the scenario materializes. The Iran conflict’s impact on oil markets is high because of the Strait of Hormuz chokepoint. Understanding which geopolitical risks have high market impact concentrations is essential for portfolio risk management.
Duration refers to how long the disruption is likely to persist. Short-duration disruptions (days to weeks) tend to create buying opportunities in quality assets. Long-duration disruptions (months to years) require more fundamental portfolio restructuring.
Market Pricing refers to how much of the risk is already reflected in asset prices. A risk that is widely discussed and broadly feared may already be priced in — making the actual event a “sell the news” situation. Conversely, an underpriced risk represents the most attractive investment opportunity.
Of the four, duration is the one investors consistently get wrong, and the 2026 Hormuz shock is an unusually clean natural experiment in why.
Worked Example: What the March 2026 Oil Shock Actually Did
Frameworks are cheap. Here is the whole thing run against a real event, using series we publish and update rather than recollection.
Brent crude
The escalation around the Strait of Hormuz produced one of the largest one-month moves in modern oil history. Every tracker below is sourced from a government statistical agency, and the full series are linked.
| Series | Feb 2026 | Mar 2026 | Jun 2026 | Latest |
|---|---|---|---|---|
| Brent crude | $71.32 | $126.69 | $70.46 | $96.02 |
| European gas | $11.19 | $17.67 | $15.09 | $17.93 |
| Dollar index | 117.82 | 121.03 | 120.92 | 118.75 |
| 10y–2y spread | 0.59 | 0.51 | 0.30 | 0.41 |
| US core inflation | 2.73% | 2.67% | 2.81% | 2.79% |
| Fed funds, upper | 3.75% | 3.75% | 3.75% | 3.75% |
Probability and impact scored correctly. Brent rose 77.6% in a single month. European gas rose 57.9%. The dollar caught a 2.7% risk-off bid, exactly as the safe-haven hierarchy predicts. The yield curve flattened from 0.59 to 0.51 — the bond market pricing damage to growth rather than a sustained inflation problem, which was the correct read and available in real time.
Duration scored catastrophically. Brent gave back 44.4% from the March close and was trading below its pre-escalation February level by the end of June. The consensus — including ours — treated a logistical interruption as a structural supply loss. Chokepoint disruption removes barrels from transit; it does not destroy reserves, wells or refineries. When transit resumed, the shut-in Gulf production and the stored barrels came back at once.
The finding worth keeping
Now the part almost nobody measures. Trace the shock into the macro.
US core inflation ran 2.73% in February, 2.67% in March, 2.99% in April, then 2.96%, 2.81%, 2.79%. Across the entire year it never left a 2.67–2.99% band. The Federal Reserve held its target range at 3.75% throughout — not one move, from December 2025 to September 2026, through the largest oil shock in the series.
Two honest qualifications. Core CPI excludes energy by construction, so the direct price effect is absent from it entirely; the April uptick measures second-round pass-through into transport and input costs. And a single 0.32-point move sits inside the ordinary month-to-month variation of this series. Put together, that is the finding: at this magnitude and this duration, the shock is not cleanly distinguishable from noise in core inflation.
The stagflation scenario was the loudest argument in the market in March 2026. It never appeared in the data. That is not luck — it follows directly from duration. An energy shock has to persist to embed itself in wages and expectations. A three-month round trip does not have time.
What the framework should have produced
High probability. High impact. Short duration. Those three together do not describe a directional trade in oil; they describe a volatility trade. Brent printed $61.35 and $126.69 within nine months — a 107% spread. Almost every strategic recommendation written in March 2026, including our own, was a directional bet where a range view was the correct expression.
There is one durable exception, and it is instructive. European gas did not round-trip. It went from $11.19 in February to $17.67 in March and was still $17.93 in July — up 56% year on year while crude sat well off its highs. Europe’s energy problem is contractual and structural; the oil market’s was logistical and cleared. Same shock, same week, opposite duration. Duration is not a property of the event. It is a property of the market the event hits.
The Sector Rotation Playbook
Geopolitical events trigger predictable sectoral rotations that sophisticated investors can position for in advance.
Military conflict: Capital flows toward defense, energy, and hard commodities. It flows away from consumer discretionary, airlines, and economically sensitive sectors. Safe haven assets — US Treasuries, gold, Swiss franc, Japanese yen — attract capital as risk aversion rises.
Trade tensions: Capital flows toward domestically oriented businesses in affected economies. Export-oriented companies, multinational supply chains, and sectors dependent on cross-border components face headwinds.
Technology restrictions: Semiconductor equipment companies, domestic AI infrastructure, and companies with diversified geographic revenue bases outperform. Companies with concentrated exposure to restricted markets face significant risk.
Sanctions regimes: Energy exporters (if the sanctioned country is a major producer) and commodity suppliers with geographic diversification outperform. Financial institutions with cross-border exposure can face significant regulatory and compliance risk.
The Safe Haven Hierarchy
When geopolitical risk rises sharply, not all safe havens are equal. Gold is the most reliable safe haven across the broadest range of geopolitical scenarios — stateless, internationally liquid, and with no counterparty risk. US Treasuries are the world’s preeminent safe haven for financial crises, though when geopolitical events drive inflation expectations (as with the Iran oil shock), they can sell off simultaneously with risk assets. The Swiss franc and Japanese yen are traditional safe haven currencies, though their effectiveness depends on whether the shock affects their home economies. Bitcoin has increasingly attracted attention as a potential geopolitical safe haven, though its correlation with risk assets in stress periods remains inconsistent.
Building a Geopolitically Resilient Portfolio
Maintain commodity and energy exposure. A portfolio with zero energy exposure is geopolitically fragile. Even a modest allocation to energy equities or commodity exposure provides meaningful hedging against the most common geopolitical transmission mechanism.
Diversify geographic revenue exposure. Companies generating revenue across multiple regions and currencies are naturally more resilient to regional geopolitical shocks.
Hold some gold. A 3–8% allocation, depending on risk tolerance, provides a hedge against geopolitical scenarios that traditional portfolio diversification cannot address.
Monitor key geopolitical indicators. Five series do most of the work, and all five are on our trackers page, updated from primary sources: Brent crude for Middle East and energy security risk, European gas for the structural half of the same story, the dollar index for global risk appetite, the 10y–2y spread for whether the bond market is pricing growth damage or inflation, and European NATO defence spending for whether rearmament is money or announcement.
Use geopolitical volatility as a signal. When events drive sharp asset price dislocations, quality assets often sell off indiscriminately. These are the most attractive entry points for long-term investors — but capturing them requires the discipline of maintaining cash reserves during calm periods.
FAQ
Do geopolitical events actually move markets long term?
Less often than the coverage implies. The March 2026 Hormuz escalation moved Brent 77.6% in a month and had fully round-tripped within three, with US core inflation never leaving a 2.67–2.99% band and the Fed holding rates unchanged throughout. Most geopolitical shocks are duration-limited and resolve as volatility rather than as a new price level. The exceptions are events that change contracts and infrastructure rather than transit — European gas after 2022 being the clearest case.
What is the best hedge against geopolitical risk?
Gold is the most reliable across the widest range of scenarios: stateless, liquid, no counterparty. A 3–8% allocation is a common range. Treasuries hedge financial crises well but can sell off alongside equities when the shock is inflationary. The under-used hedge is simply owning some energy exposure, because energy is the most common transmission mechanism from conflict to portfolio.
How do I know if a geopolitical risk is already priced in?
Compare the asset price to the pre-event baseline and ask what scenario the gap implies. In March 2026 Brent at $126.69 against a $71.32 February level implied a sustained loss of supply, not a temporary interruption in transit. Naming the scenario the price requires is more useful than judging whether the price “feels” high.
Which indicators should a retail investor actually watch?
Oil, European gas, the dollar index, the 10-year minus 2-year Treasury spread, and defence spending as a share of GDP. All five are published free by government agencies, and we maintain them as trackers with the method and full series shown.
The Bottom Line
Geopolitics is not a factor outside the control of investors — it is a systematic signal that can be analyzed, anticipated, and incorporated into portfolio decision-making. In 2026, with the Iran conflict reshaping energy markets, the US-China tech war restructuring semiconductor supply chains, and NATO’s defense buildout redirecting government capital, the geopolitical signal has never been louder. The question is whether you have a framework to hear it.
_
For investors looking to position around energy, our current analysis covers the best oil stocks to buy in 2026 — including CVX, XOM, COP and the refiner play most analysts are missing. For the latest on the Hormuz supply shock, see our deep dive on why Goldman Sachs now sees $111 oil through 2027 despite the recent pullback to $99.
_
Stay ahead of the markets. — AI Capital Wire Team