Geopolitics & Markets
Iran War Drives Oil to $120 — How to Protect Your Portfolio in 2026
Oil prices surged to nearly $120/barrel as the US-Iran conflict threatens the Strait of Hormuz. Here’s what every investor needs to know to navigate the energy shock.
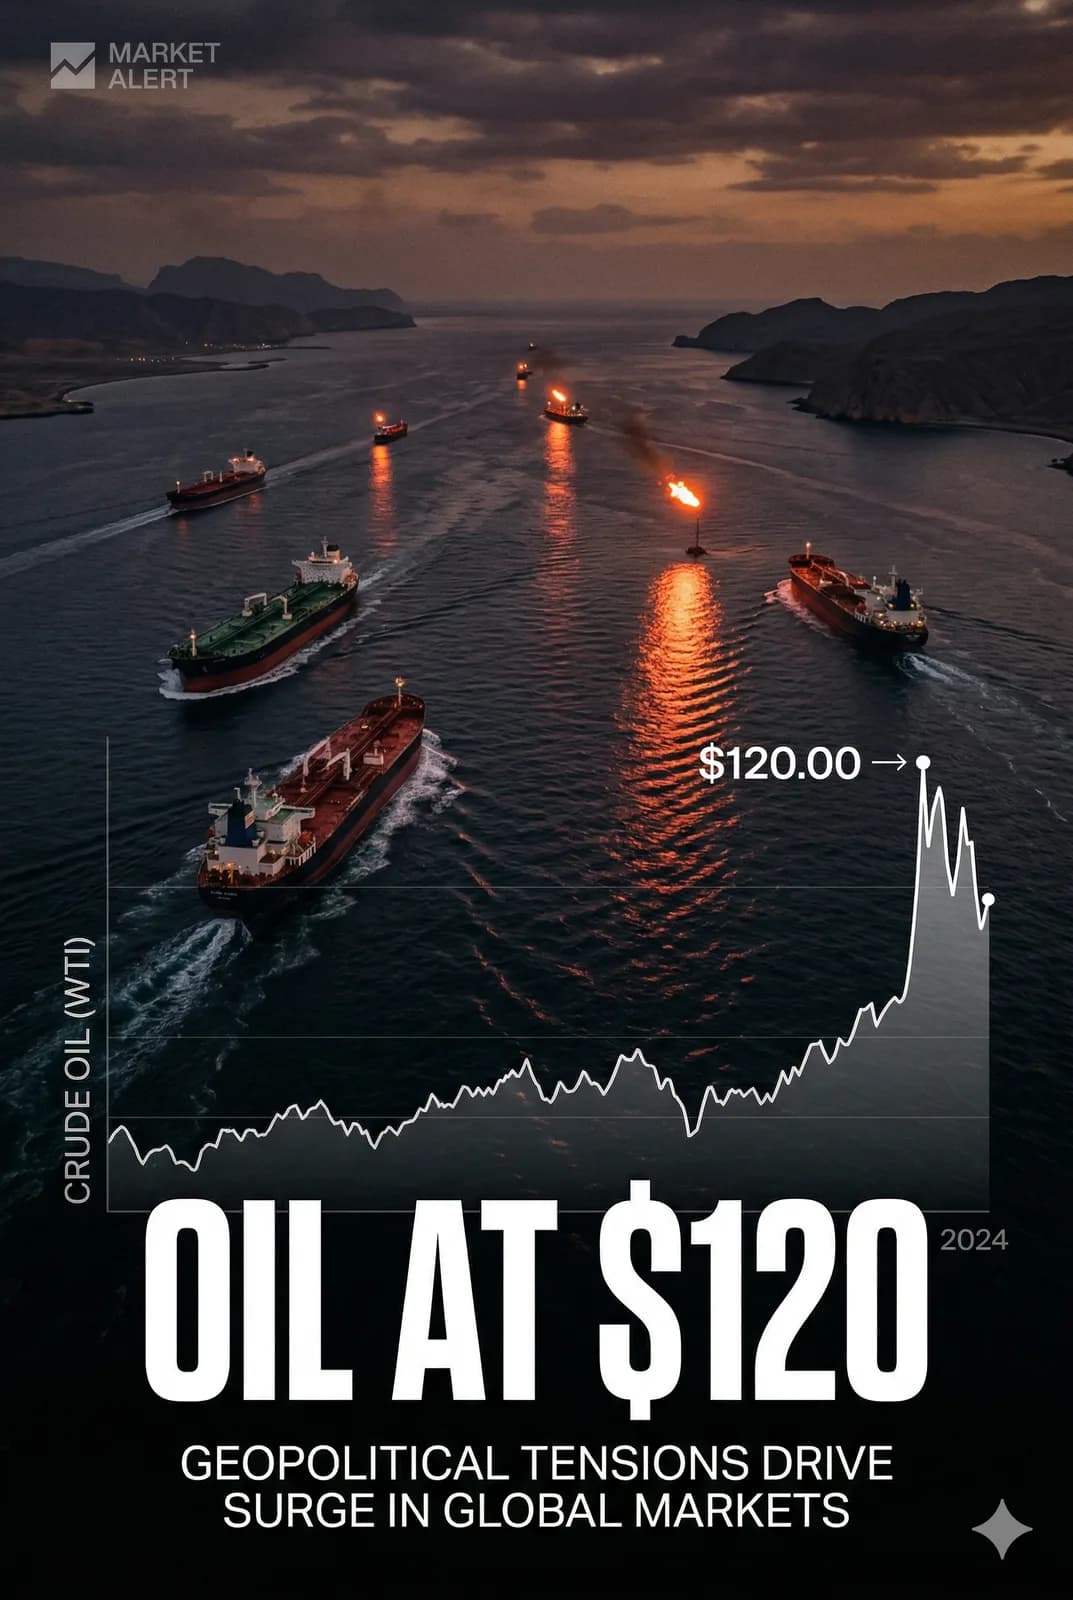
Update, 7 September 2026. This piece was published on 24 March 2026 and argued that oil near $120 was “not a short-term aberration.” That call was wrong, and the record is below in full. Brent closed March at $126.69, then fell to $70.46 by the end of June — a 44% round trip in three months, taking it below its pre-crisis February level. It has since recovered to $96.02. The original article is preserved unedited beneath this note, followed by what the data actually did and what we got wrong. All figures are from our Brent crude tracker, sourced from the U.S. Energy Information Administration.
The world’s energy markets are in crisis mode. As the US-Iran conflict enters its second month, Brent crude oil has surged to nearly $120 per barrel — levels not seen since July 2008 — while liquefied natural gas (LNG) prices have rocketed 50% since hostilities began. For English-speaking investors, the message is clear: the geopolitical shock is not temporary, and portfolios built for the calm of 2025 are dangerously exposed.
The Strait of Hormuz: The World’s Most Dangerous Chokepoint
The Strait of Hormuz, the narrow waterway between Iran and Oman, is the single most critical artery for global oil and gas flows. Roughly 20% of the world’s traded petroleum and a significant share of LNG pass through this 33-kilometre-wide passage every day. When access is disrupted, the ripple effects are immediate and severe.
The 2026 conflict has effectively suspended approximately one-fifth of global crude oil and natural gas supply. Tanker traffic disruptions have forced Gulf producers — including Saudi Arabia, the UAE, and Kuwait — to curtail output simply because they have run out of onshore storage capacity. Morgan Stanley’s analysis puts the disruption premium at $7–10 per barrel for Brent crude, and markets are pricing something close to that figure in. Brent surged from approximately $81 in early March to over $106 by March 20 — a 30% move in under three weeks — before briefly touching $112.
Brent crude
The Inflation and Stagflation Risk
Energy prices are the most direct transmission mechanism between geopolitical disruption and household economics. California gasoline prices have already crossed $5 per gallon. In the UK, petrol prices are approaching record highs. In Germany, industrial energy costs are once again threatening the competitiveness of Europe’s largest manufacturing sector.
The macroeconomic consequences are not subtle. The European Central Bank, which had been widely expected to continue its rate-cutting cycle through the first half of 2026, postponed its planned reductions on March 19. The ECB simultaneously raised its 2026 inflation forecast and cut its GDP growth projections — a textbook stagflationary signal. For investors, stagflation is the most difficult macroeconomic environment to navigate: equities face pressure from slowing growth, bonds face pressure from persistent inflation, and cash loses purchasing power.
Where Capital Is Moving
In the immediate aftermath of the conflict’s escalation, institutional capital has rotated into three primary areas.
Energy equities. Integrated oil majors such as ExxonMobil, Shell, BP, and TotalEnergies have seen significant multiple expansion as their reserve bases and production profiles become suddenly more valuable. US shale producers, largely insulated from Middle East supply disruptions, have attracted particular attention. The Permian Basin’s significance to global energy security has never been higher.
Defense and aerospace. Governments across Europe, Asia, and the Middle East are accelerating defense procurement. NATO member states are fast-tracking spending commitments to meet the 2% GDP target — a figure many are now exceeding. Defense primes, aerospace suppliers, and cybersecurity firms are benefiting from a sustained increase in government contract flow.
Alternative energy. Paradoxically, the conflict has accelerated interest in energy independence strategies. Solar, nuclear, and battery storage investments have seen renewed inflows from institutional players who view geopolitical risk as a permanent feature of fossil fuel dependence.
What to Avoid Right Now
Airlines face a double squeeze from higher fuel costs and demand uncertainty. Consumer discretionary companies with energy-intensive supply chains face margin compression. Emerging market economies that are net oil importers — including India, South Korea, Japan, and most of Southeast Asia — are seeing their current account balances deteriorate rapidly. Fixed-income investors holding long-duration government bonds in countries with high energy import dependence should review their exposure carefully.
The Dollar’s Role
Oil is priced in US dollars, and the dollar has strengthened modestly in the risk-off environment. This creates a complex feedback loop for global investors. A stronger dollar tightens financial conditions in emerging markets, increases the cost of dollar-denominated debt service, and puts additional pressure on commodity-importing economies. The Federal Reserve finds itself in an uncomfortable position: inflation pressures from energy prices argue against rate cuts, while slowing growth argues for them.
The Investment Framework
In periods of geopolitical-driven commodity shocks, history offers a consistent playbook: overweight energy, defense, and hard assets; underweight consumer discretionary, long-duration bonds, and energy-intensive industries; increase cash allocations to preserve optionality for the dislocation opportunities that typically follow the peak of panic. The World Economic Forum estimates the total global economic cost of the conflict at multiple trillions of dollars if the disruption persists beyond six months — not a tail risk, but a central scenario markets must continue to price.
The Bottom Line (as published, 24 March 2026)
Oil at $120 per barrel is not a short-term aberration. It reflects a fundamental disruption to global energy supply chains. Investors who adapt their portfolios to the new reality — overweighting energy, defense, and real assets while reducing exposure to rate-sensitive and energy-intensive sectors — are best positioned to navigate what comes next.
What Happened Next, and What We Got Wrong
The paragraph above is the call. Here is the price.
| Month end | Brent, USD/bbl |
|---|---|
| Dec 2025 | $61.35 |
| Feb 2026 | $71.32 |
| Mar 2026 | $126.69 |
| Apr 2026 | $124.24 |
| May 2026 | $92.88 |
| Jun 2026 | $70.46 |
| Jul 2026 | $96.95 |
| Aug 2026 | $89.75 |
| 1 Sep 2026 | $96.02 |
Brent peaked at a month-end close of $126.69 on 31 March, one week after publication, then fell 44.4% to $70.46 by 30 June — below the $71.32 it traded at in February, before the escalation. The specific sentence “not a short-term aberration” was wrong within a single quarter.
Three things we got wrong
We mistook a supply interruption for a supply loss. Hormuz disruption removes barrels from the market for as long as the disruption lasts. It does not destroy reserves, wells or refineries. Once transit resumed, the curtailed Gulf production that had been shut in for lack of onshore storage came back quickly, and the barrels that had been diverted or stored were sold into the recovery. A price built on a flow interruption unwinds at the speed the flow is restored.
We extrapolated a price rather than a mechanism. “Oil at $120” was a level, and levels are the easiest thing to be wrong about. The defensible version of the argument was about the mechanism — that Hormuz risk is chronically underpriced and reasserts itself — and that version has aged far better than the number attached to it.
We were too confident about persistence and not confident enough about volatility. The trade that worked was not owning oil at $126. It was expecting the range to widen. Brent has printed $61.35 and $126.69 inside nine months, a 107% spread. Almost every strategic recommendation in the original piece was a directional bet where a volatility view was the correct expression.
What we got right
Gas, not crude, carried the durable damage. European natural gas went from $11.19/MMBtu in February 2026 to $17.67 in March, and unlike oil it did not come back: it was still $17.93 in July 2026, up 56% on the same month a year earlier, with crude by then well off its peak. Europe’s energy problem is structural and supply-contracted; the oil market’s was logistical and cleared. The European natural gas tracker has the full series.
The repricing was real, just smaller than we said. At $96.02, Brent sits 34.7% above its pre-crisis February level. There is a persistent geopolitical component in the price. It was worth roughly $25 a barrel, not $55.
Volatility itself was the signal. The range widened permanently, and it has stayed wide: $96.95 in July, $89.75 in August, $96.02 in September. That is the honest legacy of the episode.
What this changes about how we write
We now publish the underlying series rather than a target, and we update it. If we had been running the Brent tracker in March 2026, the June print would have contradicted this article in public within twelve weeks, without anyone having to go looking for it. That is the entire argument for maintaining trackers instead of filing predictions, and this piece is the reason we make it.
This correction is also logged on our corrections page.
Stay ahead of the markets. — AI Capital Wire Team