Artificial Intelligence
How to Build an AI Investment Portfolio in 2026: The Complete Framework for Serious Investors
A complete framework for building an AI-focused investment portfolio in 2026. From infrastructure to applications to power — here’s how sophisticated investors are allocating capital.
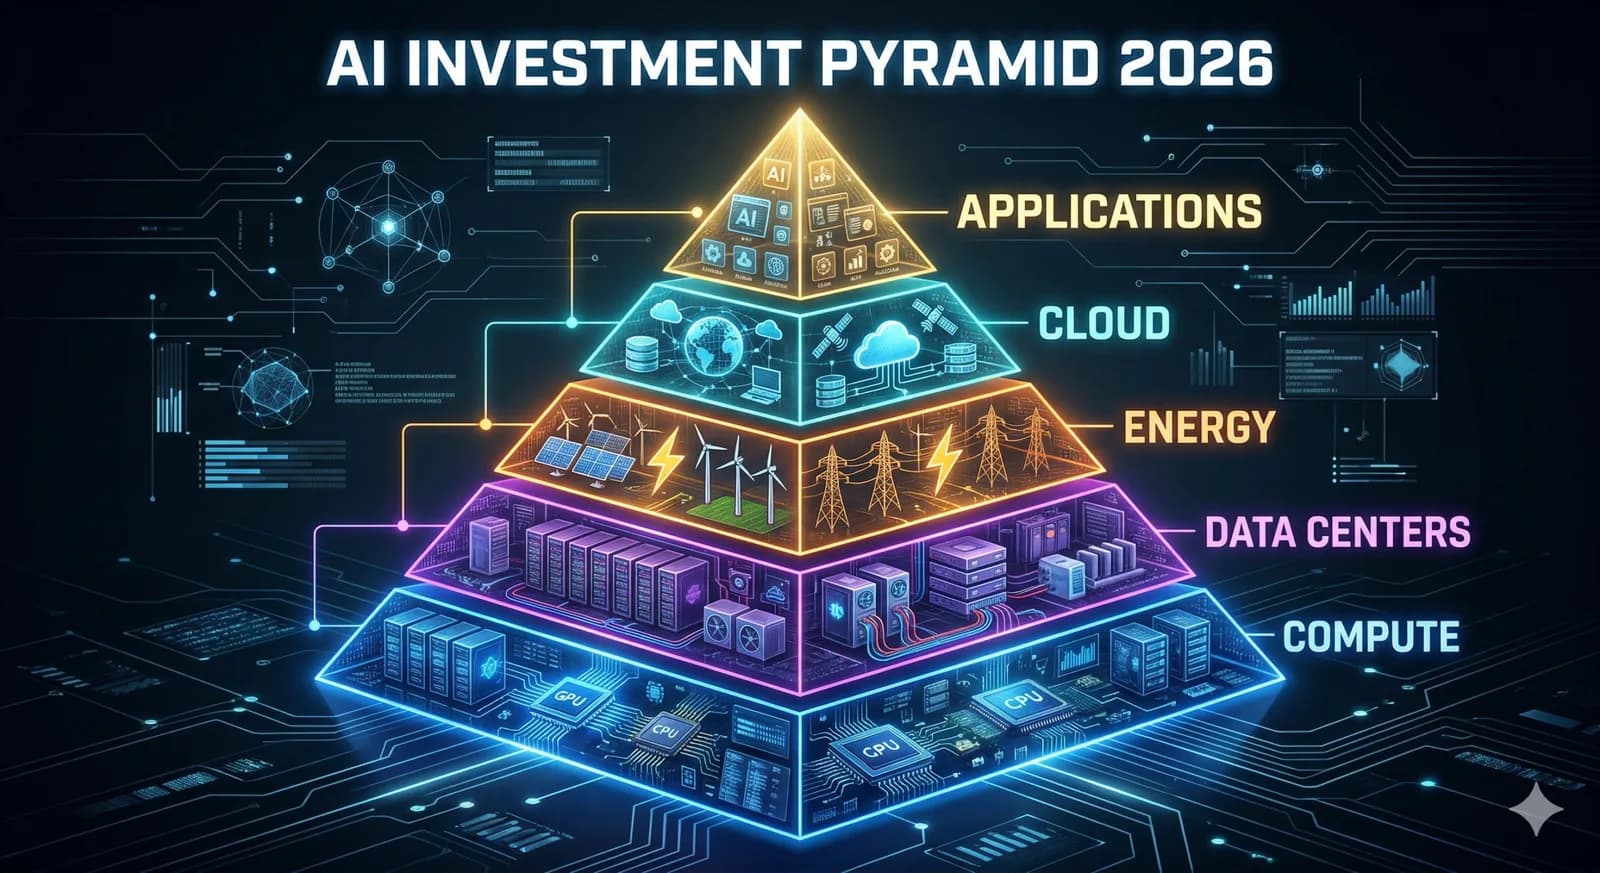
The artificial intelligence revolution is the most significant technological transformation since the advent of the internet. Unlike many previous technology narratives, AI is already generating real economic value at scale — and the infrastructure required to sustain and accelerate that value creation represents one of the largest capital allocation opportunities of the decade. But investing in AI is not as simple as buying a basket of technology stocks. A disciplined, framework-driven approach is essential.
The framework below is built around one number, because one number governs almost everything else in this trade: what Microsoft, Alphabet, Amazon and Meta actually spend on property and equipment. Not what they guide to — what has already left the bank account and appears in a filing. In the first quarter of 2026 those four companies together spent $129.8 billion, against $71.9 billion in the same quarter of 2025. That is the engine. Every layer described here is either being paid by it or will eventually have to justify it.
Understanding the AI Value Chain
The AI economy is a layered system of interdependent markets, each with distinct competitive dynamics, risk profiles, and return characteristics. Successful AI investors must understand where value is being created — and where it is being competed away.
Layer 1: Compute Infrastructure
The foundation of the AI economy is compute — the raw processing power required to train and run AI models. This layer is dominated by Nvidia, which has achieved an extraordinary degree of market leadership in AI accelerator chips. AMD, Intel, and a range of custom chip designers (Broadcom, Marvell, Groq) are competing for share. Investment characteristics: high growth, high volatility, subject to product cycle risk, and sensitive to US-China policy changes.
Layer 2: Data Center Infrastructure
Training and running AI models requires massive physical infrastructure: data centers equipped with specialized cooling, high-speed networking, and enormous power supplies. The hyperscale data center operators — Amazon (AWS), Microsoft (Azure), and Google (Google Cloud) — are investing hundreds of billions of dollars here. Supporting them are data center construction companies, power management firms, cooling system suppliers, and networking equipment manufacturers. This layer tends to be more stable than pure semiconductor plays, with longer contract cycles and more predictable revenue streams.
Layer 3: Energy and Power
Perhaps the most underappreciated layer of the AI value chain is energy. A modern AI training cluster can consume as much electricity as a small city. This creates investment opportunities in nuclear energy (small modular reactors are attracting serious attention from tech companies), utility-scale solar and wind, grid infrastructure, and battery storage. The energy layer of the AI trade is still early but is attracting rapidly growing institutional interest.
Layer 4: Cloud Platforms
The cloud computing layer is where most enterprises interact with AI. AWS, Azure, and Google Cloud are the dominant platforms, offering AI models and tools on demand. These companies benefit from the AI buildout at every level. For investors seeking AI exposure with defensive characteristics — stable cash flows, diversified revenue streams, dominant market positions — the hyperscale cloud platforms represent the most compelling risk-adjusted opportunity in the AI trade.
Layer 5: AI Application Software
The application layer is where AI capabilities are translated into economic value for end users. This includes enterprise software companies embedding AI into existing products (Salesforce, ServiceNow, SAP), pure-play AI application companies (Palantir, C3.ai), and an emerging ecosystem of AI-native startups. This layer carries the highest potential return — but also the highest uncertainty, with the risk of AI capabilities becoming commoditized reducing pricing power over time.
Hyperscaler capital expenditure, first quarter
The One Number That Prices All Five Layers
The chart above is our hyperscaler capital expenditure tracker: combined purchases of property and equipment reported by Microsoft, Alphabet, Meta and Amazon in their own SEC filings, read from the EDGAR XBRL API. We compare first calendar quarters only, because these four run different fiscal years and their annual totals do not line up — Q1 is the one period all four report on the same three-month basis. It is total capex, not an AI-only figure, because no filing breaks out AI spend and we are not going to estimate one.
Here is what it says:
| Q1 | Combined capex | Change |
|---|---|---|
| 2018 | $16.1bn | — |
| 2021 | $27.4bn | — |
| 2023 | $33.9bn | — |
| 2024 | $44.3bn | +30.7% |
| 2025 | $71.9bn | +62.3% |
| 2026 | $129.8bn | +80.5% |
Three observations that shape portfolio construction.
First, the level. Eight years took the number from $16.1bn to $129.8bn — roughly 8x, a compound annual rate near 30%. This is not a technology adoption curve. It is an industrial buildout, and it behaves like one.
Second, the acceleration. Growth went 30.7% → 62.3% → 80.5% across the last three years. The rate of change is still rising. That matters more than the level, because the layers closest to the spending are priced off the derivative, not the total.
Third, and least discussed: capex becomes depreciation. Every dollar of this spend lands on the balance sheet and then works its way through the income statement over the asset’s useful life. While capex is growing at 80% a year, depreciation lags far behind it and margins look excellent. When the growth rate flattens, depreciation catches up — at a steady run rate, annual depreciation converges on annual capex. The margin cushion in the current numbers is a function of the growth rate, not of the business quality. That is the single most underweighted risk in the AI trade.
How the layers respond when the number turns
This is the practical use of the tracker. The five layers are not equally levered to it.
- Layer 1 (compute) is the most levered and the most immediate. Nvidia and AMD sell into this capex directly; their revenue is close to a first derivative of it. They re-rate hardest in both directions.
- Layer 2 (data centre infrastructure) lags by a quarter or two — contracts are signed before equipment is shipped — and is somewhat protected by construction backlogs already under contract.
- Layer 3 (energy) has the longest lead time and the least AI-specific downside. A gigawatt of new generation has customers regardless.
- Layer 4 (cloud platforms) is the spender, not the recipient. A slowdown in its own capex is initially good for its free cash flow. This is why the hyperscalers are the defensive way to own the theme.
- Layer 5 (applications) is disconnected from the capex number in the short run and completely dependent on it in the long run: this is the layer that has to generate the revenue that justifies $130bn a quarter.
A portfolio that owns all five layers in equal weight is not diversified. It is concentrated in a single variable, expressed five different ways with five different lags.
Portfolio Construction Principles
Diversify across the stack. An AI portfolio concentrated exclusively in semiconductor stocks is betting heavily on hardware cycles and policy variables. A portfolio spanning compute, infrastructure, energy, cloud, and applications is more resilient to any single point of failure.
Weight by conviction and risk tolerance. Infrastructure layers (compute, data center, cloud) tend to offer higher conviction with lower volatility. A balanced allocation might weight infrastructure at 60–70% and applications at 30–40%.
Include non-obvious beneficiaries. Some of the best risk-adjusted returns in a technology transformation come from picks-and-shovels suppliers: cooling systems, specialized networking, power management, and industrial gases used in semiconductor manufacturing.
Size for volatility. AI stocks are not utility stocks. 30–50% drawdowns are possible even in secular bull markets. Position sizing should reflect this reality to avoid forced selling at the worst possible time.
Monitor the policy environment. US-China technology trade policy, AI regulation in the EU and UK, and domestic antitrust considerations can all move individual AI stocks significantly. A disciplined AI investor monitors the policy environment as closely as earnings reports.
Projections Versus Measurements
BlackRock estimates $5–8 trillion in AI-related capex through 2030. Morgan Stanley projects $3 trillion by 2028 with 80% of spending still ahead. These are forecasts, and the range between them — a factor of nearly three at the extremes — tells you how much confidence to place in any of them.
Compare that with what is actually observable. Four companies, one quarter, $129.8 billion, taken from documents they are legally liable for. Annualising a single quarter is crude — capex is typically back-weighted, so four times Q1 understates the year — but even that conservative arithmetic puts these four alone above $500 billion a year, before counting Oracle, Tesla, Apple, the neoclouds, the sovereign programmes or anyone in China.
The forecasts may well prove right. The point is that you do not need them. The measured number updates every quarter, comes from a primary source, and is the thing the forecasts are trying to predict.
What Would Invalidate This Framework
Two things, and both are visible in the same series.
Deceleration. The first Q1 that prints below the prior year — or even a sharp step down in the growth rate, say from 80% to 20% — marks the top of the capital cycle. Layer 1 prices that in within days; layers 2 and 3 take quarters. If you are overweight compute, this is the number that tells you to stop being overweight compute.
Convergence with depreciation. Watch operating margins at the hyperscalers against their capex growth. When depreciation growth catches capex growth, the reported earnings of the most defensive layer in the stack deteriorate without anything changing in the business.
Neither of these requires a view on whether AI works. They only require reading the filings, which is why we keep the capex tracker updated rather than publishing a forecast once and moving on.
FAQ
How much are the hyperscalers actually spending on AI?
No public filing breaks out AI-only capital expenditure, so the honest answer is that nobody knows precisely. What is disclosed is total purchases of property and equipment: $129.8 billion across Microsoft, Alphabet, Amazon and Meta in Q1 2026, up 80.5% year on year. AI is the dominant driver of the increase, but the figure includes offices, non-AI servers and other assets. Anyone quoting it as a pure AI number is adding precision the filings do not contain.
What percentage of a portfolio should be in AI?
There is no universal answer, and anyone offering one without knowing your time horizon and drawdown tolerance is guessing. The structural point is that 30–50% drawdowns have occurred in secular technology bull markets, so the position should be sized to survive one without forced selling. If a 40% fall in the position would change your behaviour, the position is too large.
Which layer of the AI stack offers the best risk-adjusted return?
Layer 4 — the cloud platforms — on the specific grounds that they are the spenders rather than the recipients. Their non-AI revenue is large and stable, and a capex slowdown initially improves their free cash flow rather than destroying their revenue. The trade-off is that they capture less of the upside in a continued boom.
Are AI stocks in a bubble?
The capex is real, contracted and verifiable in filings, which distinguishes it from purely narrative-driven manias. The unresolved question is the return on that capital, and it is a genuine one: $500bn a year of annual spending requires very large recurring revenue to justify, and that revenue is currently a promise rather than a disclosure. Watching whether the spending decelerates is a more useful discipline than deciding the bubble question in advance.
The Long-Term Thesis
The investors who capture the most value from this transformation will be those who approach it with patience, discipline, and a genuine understanding of where in the AI value chain economic value is durable rather than competed away. Build the framework, know which single variable your positions are all secretly expressing, and know in advance what number would tell you to change your mind.
Stay ahead of the markets. — AI Capital Wire Team